Troubleshoot the startup sequence
Table of Contents
Introduction
Application startup sequences and static methods often hide critical bugs that can be extremely difficult to detect and resolve. These issues normally occur before standard telemetry systems are active, leaving developers blind right when observability is needed.
The Challenge
During application startup, several problems commonly occur:
- Configuration issues: Missing connection strings, incorrect resource access keys, or invalid settings
- Static constructor failures: Dependencies that fail silently or throw exceptions in static initialization
- Timing problems: Components attempting to access services before they’re properly initialized
The root problem is observability gaps: standard telemetry infrastructure isn’t active during startup, making these issues nearly impossible to diagnose.
Diginsight Solution
Diginsight provides observability for the whole startup sequence by means DeferredLoggerFactory, a recording logger that captures all startup activity before the telemetry system is ready.
When startup completes, all recorded logs are flushed to our configured telemetry targets.
Key benefits:
- Complete startup visibility: Every method call, configuration load, and potential failure is recorded
- No telemetry gaps: Recording starts immediately, before any other systems
- Cross-assembly support: Static methods and external dependencies can access logging
All code examples are available in the telemetry.samples repository.
Implementation Guide
Basic Setup
Here’s how to enable startup sequence observability in our application: 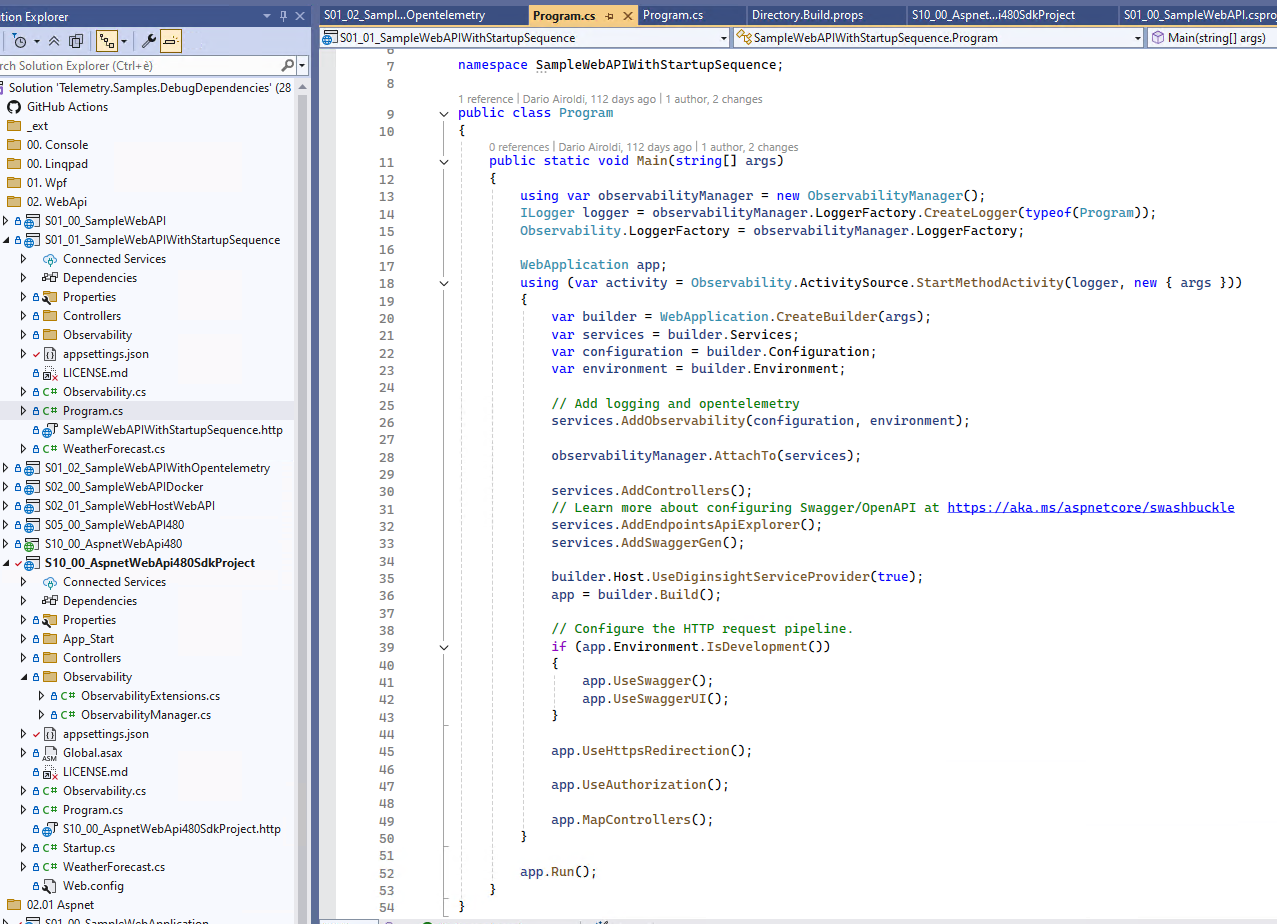
public static void Main(string[] args)
{
    // Step 1: Create ObservabilityManager immediately
    using var observabilityManager = new ObservabilityManager();
    ILogger logger = observabilityManager.LoggerFactory.CreateLogger(typeof(Program));
    Observability.LoggerFactory = observabilityManager.LoggerFactory;

    WebApplication app;
    using (var activity = Observability.ActivitySource.StartMethodActivity(logger, new { args }))
    {
        var builder = WebApplication.CreateBuilder(args);

        // Step 2: Configure Diginsight and register for flush
        builder.Services.AddObservability(builder.Configuration, builder.Environment);
        observabilityManager.AttachTo(builder.Services);

        // Standard service registration
        builder.Services.AddControllers();
        builder.Services.AddEndpointsApiExplorer();
        builder.Services.AddSwaggerGen();

        // Step 3: Enable deferred logging flush during build
        builder.Host.UseDiginsightServiceProvider(true);
        app = builder.Build(); // Flush happens here

        // Configure pipeline
        if (app.Environment.IsDevelopment())
        {
            app.UseSwagger();
            app.UseSwaggerUI();
        }

        app.UseHttpsRedirection();
        app.UseAuthorization();
        app.MapControllers();
    }

    app.Run();
}
Step 1: Initialize Deferred Logging
Create the ObservabilityManager as the very first action in our Main method:
using var observabilityManager = new ObservabilityManager();
ILogger logger = observabilityManager.LoggerFactory.CreateLogger(typeof(Program));
Observability.LoggerFactory = observabilityManager.LoggerFactory;
What happens here:
- The
ObservabilityManagercreates a recording logger that captures everything - No telemetry infrastructure is needed yet - this works immediately
- The logger starts recording all method calls, timing, and log statements
Step 2: Register for Automatic Flush
After configuring Diginsight with AddObservability(), register the manager to flush when startup completes:
builder.Services.AddObservability(builder.Configuration, builder.Environment);
observabilityManager.AttachTo(builder.Services);
What happens here:
AddObservability()configures our standard telemetry (OpenTelemetry, logging providers, etc.)AttachTo()registers a callback to flush recorded logs when the service container is built- All deferred logs will be sent to our configured telemetry targets
Step 3: Enable the Flush
Use the Diginsight service provider to trigger the flush during application build:
builder.Host.UseDiginsightServiceProvider(true);
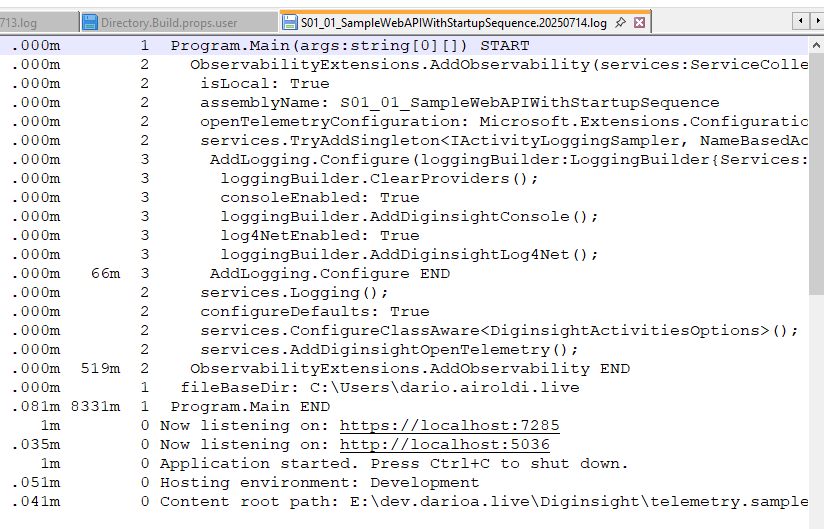
app = builder.Build(); // Flush happens automatically hereResult: Our application startup logs will show every detail of the initialization process:
Advanced: Cross-Assembly Access
For static methods or code in external assemblies that need logging during startup we can use the ObservabilityRegistry.
With Diginsight (or .net diagnostics) an Observability class is normally defined in each assembly that needs logging.
Enable Observability classes to receive LoggerFactories from ObservabilityRegistry
A simple static constructor can registers the Observability class to receive LoggerFactory objects from the ObservabilityRegistry:
internal static class Observability
{
    public static readonly ActivitySource ActivitySource = new(Assembly.GetExecutingAssembly().GetName().Name!);
    public static ILoggerFactory LoggerFactory { get; set; } = null!;

    static Observability() => ObservabilityRegistry.RegisterComponent(factory => LoggerFactory = factory);
}
Register the LoggerFactory into ObservabilityRegistry
In our startup code, register the logger factory with the registry:
using var observabilityManager = new ObservabilityManager();
ILogger logger = observabilityManager.LoggerFactory.CreateLogger(typeof(Program));

// Register globally for cross-assembly access
ObservabilityRegistry.RegisterLoggerFactory(observabilityManager.LoggerFactory);
Use the LoggerFactory in Static Methods
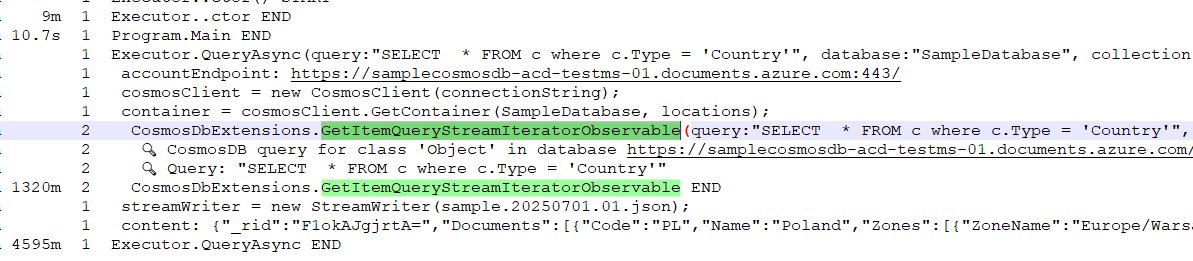
Now any static method can access logging during startup:
public static FeedIterator GetItemQueryStreamIteratorObservable(this Container container, string query, string? continuationToken = null, QueryRequestOptions? requestOptions = null)
{
    var loggerFactory = Observability.LoggerFactory;
    var logger = loggerFactory.CreateLogger(typeof(CosmosDbExtensions));
    using var activity = Observability.ActivitySource.StartMethodActivity(logger, () => new { query, continuationToken, requestOptions });

    // Method implementation with full observability
}
Result: Even static methods and external assemblies will appear in our startup logs: